
CISA KEV and EPSS have been debated and discussed as tools to enrich vulnerability data and help organizations decide what to fix. Both Data sources have helped analyse which vulnerability to address first. Any organization performing application security and infrastructure vulnerability management should consider using them. Since BOD 22-01, federal agencies must fix vulnerabilities within a specified timeframe. With this research, we cross-reference those two tools to see what trending and story we can extract from the data.
Note: The post has an embedded script and iframe to interact with the data directly. Make sure you have those enabled (on mobile, one of the visuals will ask to download a file, ignore this)
What is CISA KEV
The CISA, or Cybersecurity & Infrastructure Security Agency, is a federal agency of the United States government responsible for ensuring the security of the nation’s critical infrastructure. The Known Exploited Vulnerabilities (KEV) list typically lists known software vulnerabilities that are actively or recently exploited.
These vulnerabilities are typically discovered in popular software or systems, and the details are provided so that IT professionals and systems administrators can take the necessary steps to patch or mitigate them. The objective of this is to inform the public about existing vulnerabilities in order to prevent cyberattacks.
All federal civilian executive branch (FCEB) agencies must remediate vulnerabilities in the KEV catalogue within prescribed timeframes under Binding Operational Directive (BOD) 22-01, Reducing the Significant Risk of Known Exploited Vulnerabilities.
The following sections detail the criteria behind each of the three thresholds for KEV catalog updates, which are:
- The vulnerability has an assigned Common Vulnerabilities and Exposures (CVE) ID.
- There is reliable evidence that the vulnerability has been actively exploited in the wild.
- There is a clear remediation action for the vulnerability, such as a vendor-provided update.
What is EPSS?
The Exploit Prediction Scoring System (EPSS) is an open, data-driven effort for estimating the likelihood (probability) that a software vulnerability will be exploited in the wild. Our goal is to assist network defenders in prioritizing vulnerability remediation efforts better. While other industry standards have been useful for capturing innate characteristics of a vulnerability and providing measures of severity, they are limited in their ability to assess threats. EPSS fills that gap because it uses current threat information from CVE and real-world exploit data. The EPSS model produces a probability score between 0 and 1 (0 and 100%). The higher the score, the greater the probability that a vulnerability will be exploited.
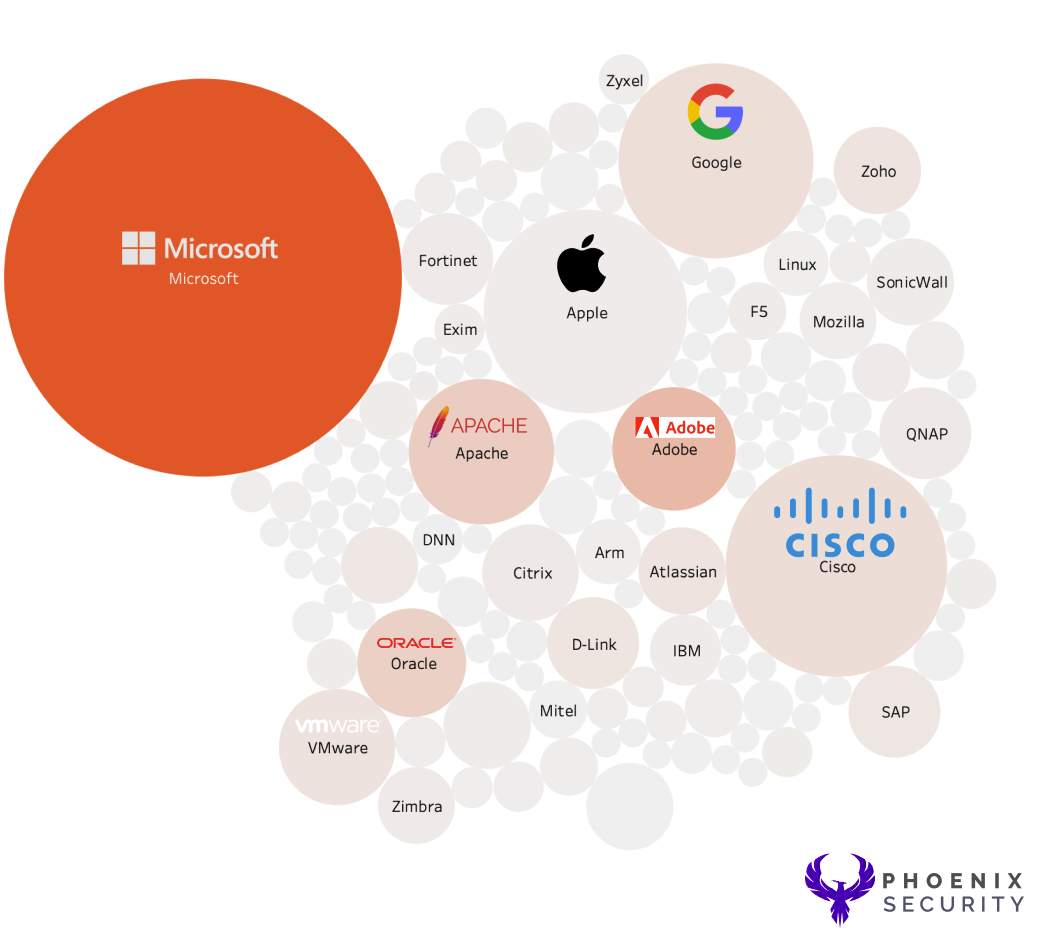
CISA KEV and EPSS who is the most exploitable product and vendor
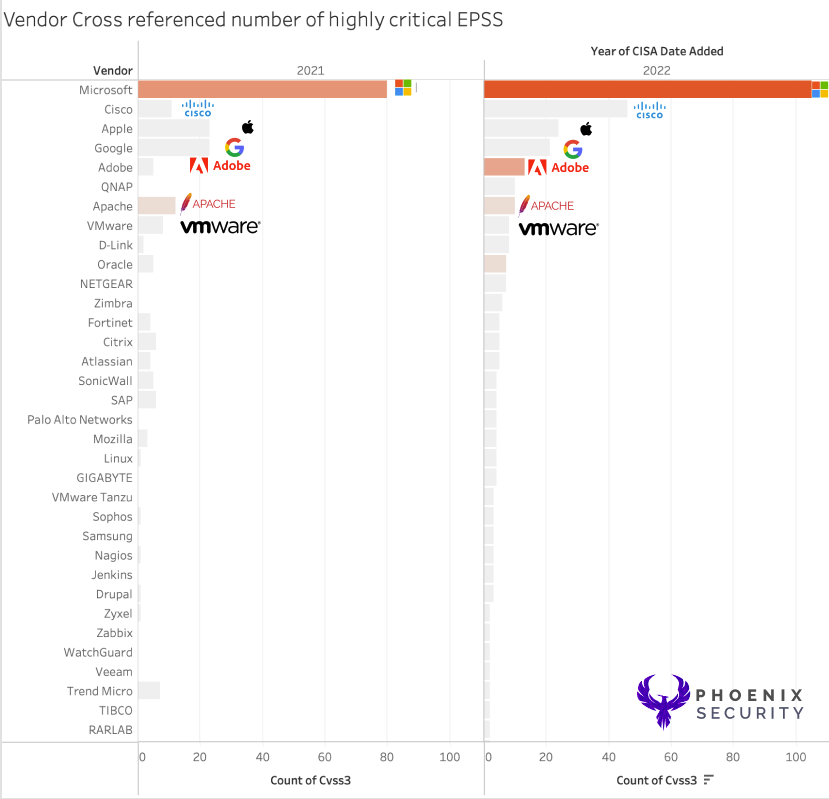
The first analysis was to cross reference EPSS and CISA KEV with the size of each element describing the count of how many vulnerabilities (regardless of the severity)
- Size = Number of exposures captured in cisa kev
- Shade (from light to dark) = EPSS scoring (from light to dark)
- Data includes all the results from the entire of the CISA KEV catalogue
DATASET:
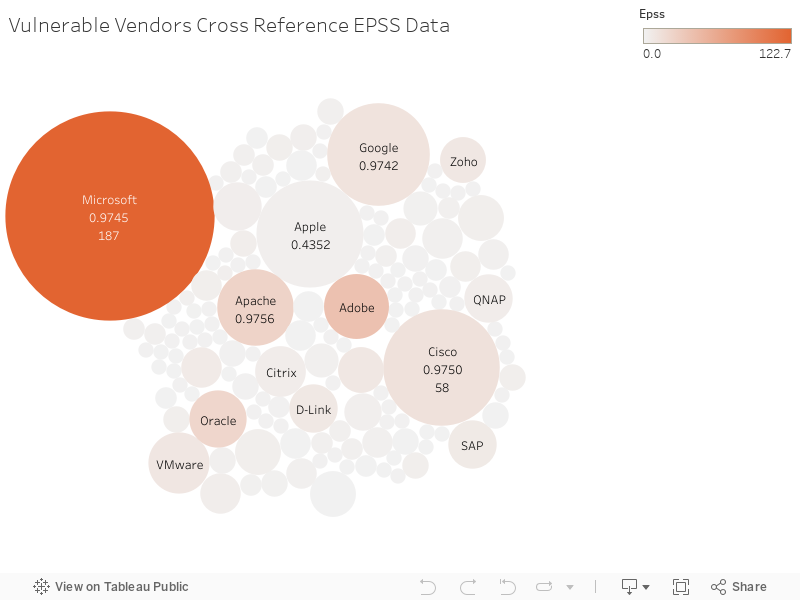
CISA Kev’s recent data (fetched mid-May 2023) shows around 1000 vulnerabilities across several products and vendors.
We cross-referenced the vulnerability data with EPSS data to explore which Vendor and product is most vulnerable.
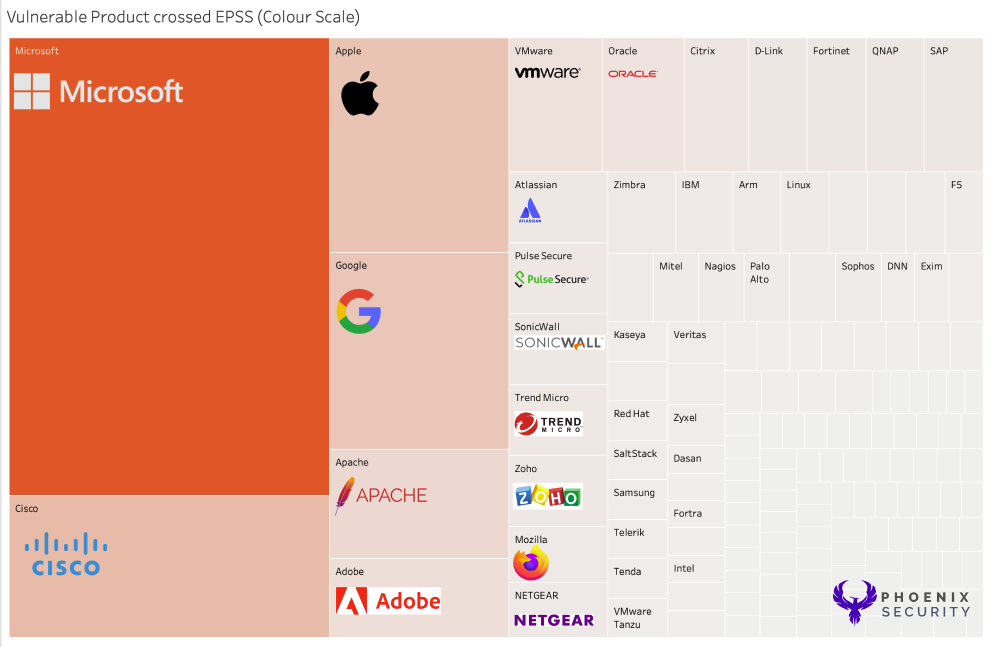
DATASET:
In the dataset, each square has
- Vendor
- Number of Vulnerabilities for the Vendors in CISA KEV
- CVSS Vulnerabilities
- Magnitude (sum) of all the EPSS Data (colour)
- Count of CVE (size of the blocks)
- Text: Vendor, Product, EPSS (95 percentile), Number of Vulnerabilities per product
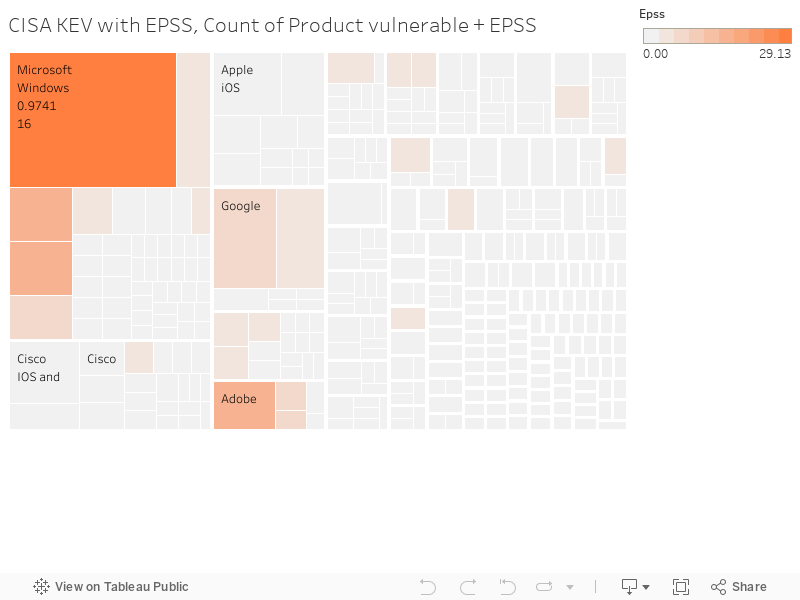
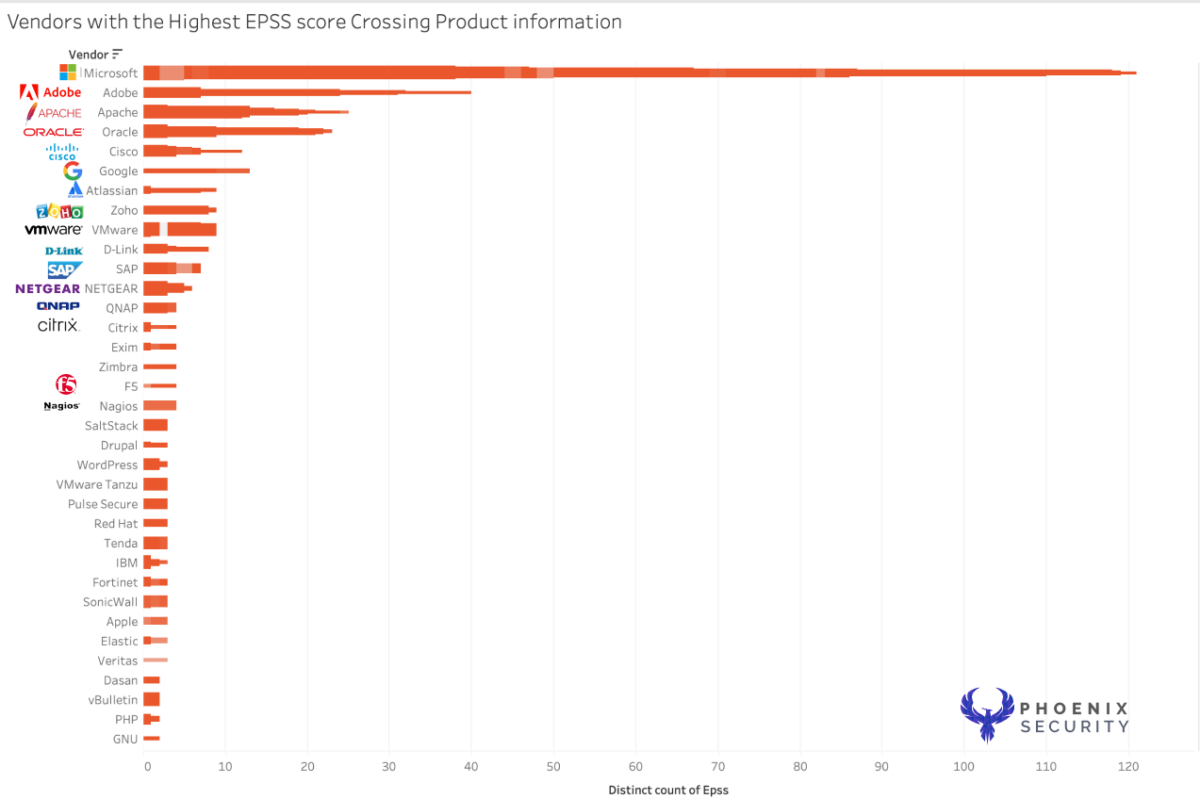
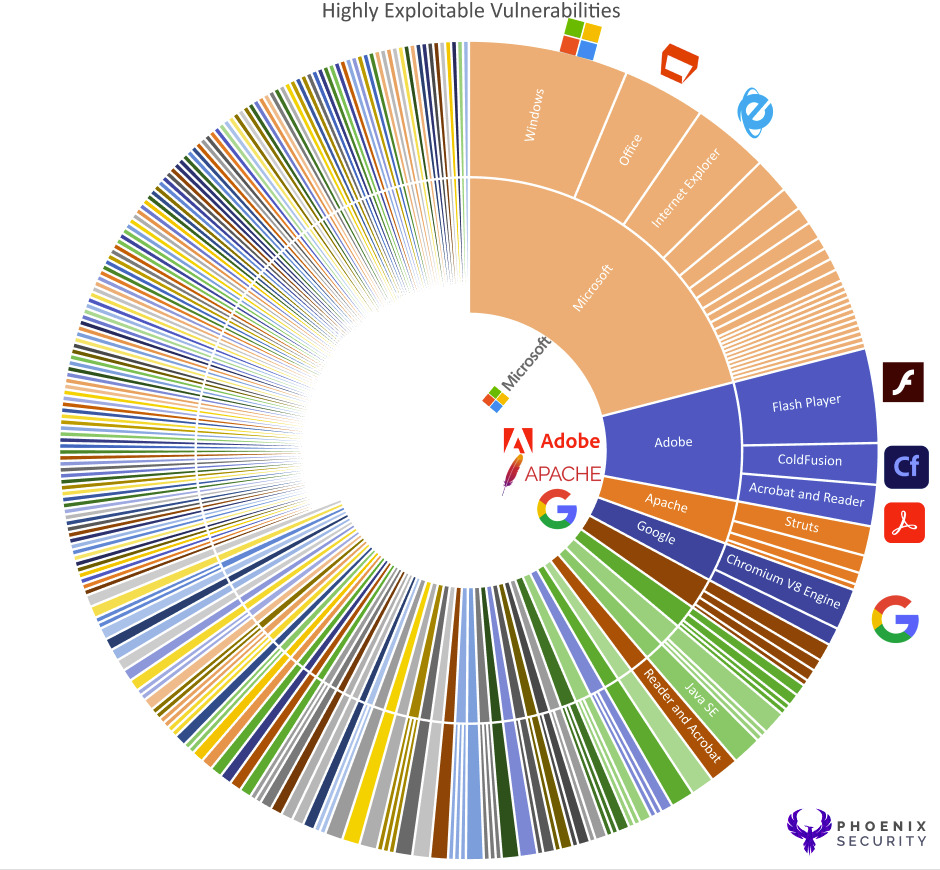
What are the vulnerable products in CISA KEV?
In this analysis, we take a cutoff point at 0.8; despite this creating a binning element, it can display which vulnerabilities are considered highly exploitable and which are not. Highly exploitable vulnerabilities tends to be on the range of 0.7 and above, even tough this is an arbitrary judgment that might disappear in the future with more data and exploits. In general, the closer to 1 the EPSS value is the higher is the probability of exploitation.
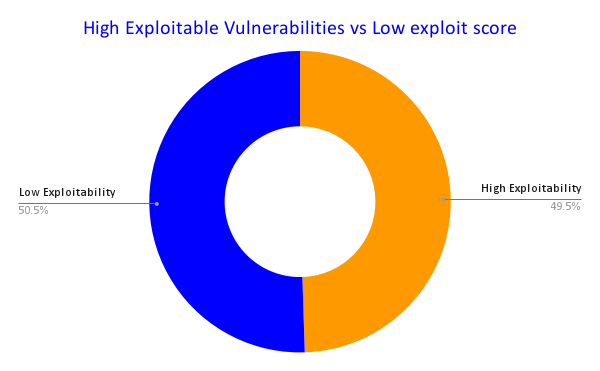
Note: for this research, we choose to bin the vulnerability in highly exploitable or low exploitability at 0.8 or higher (fairly high value). Data has shown that above 0.7 the EPSS values become highly exploitable. Nonetheless, this should not be the only value of judgment as explained below. EPSS shall be used as an indicator of exploitability together with other factors like location, business criticality, other CTI like CISA KEV and so on.
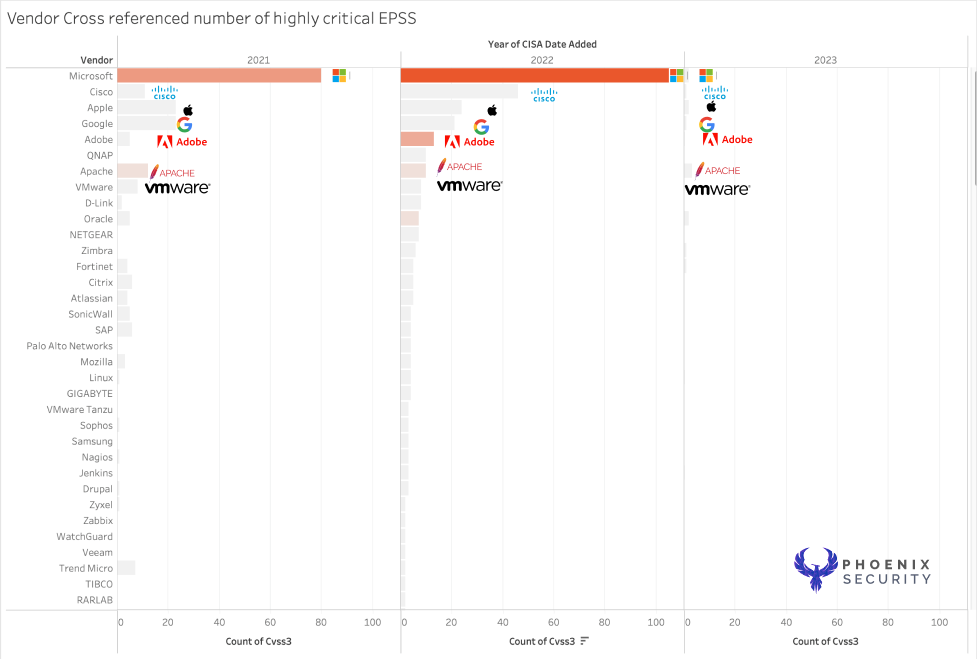
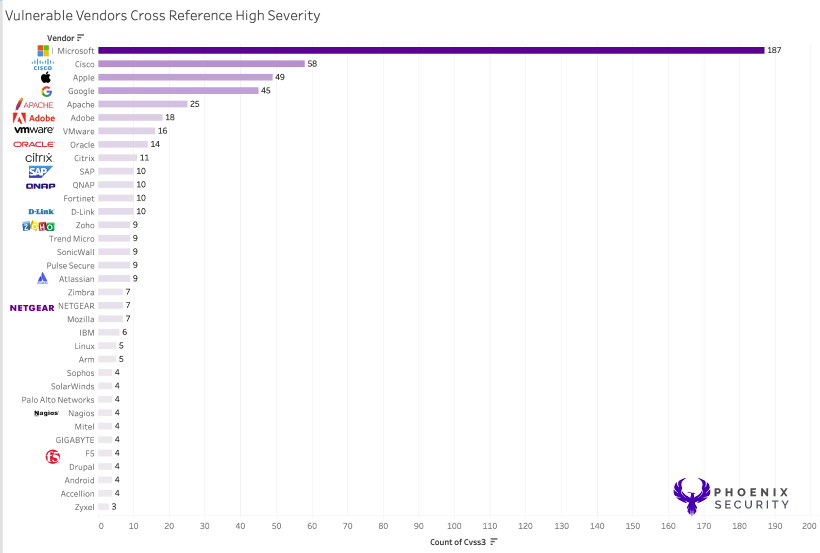
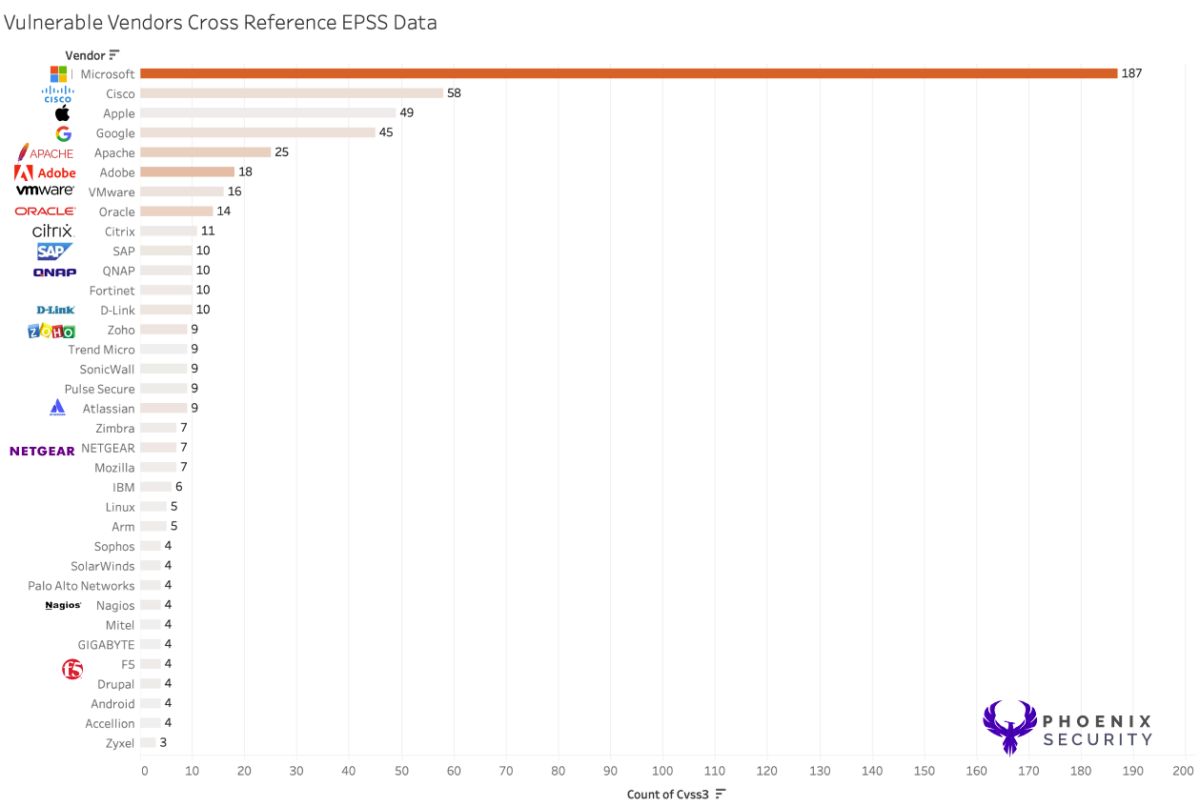
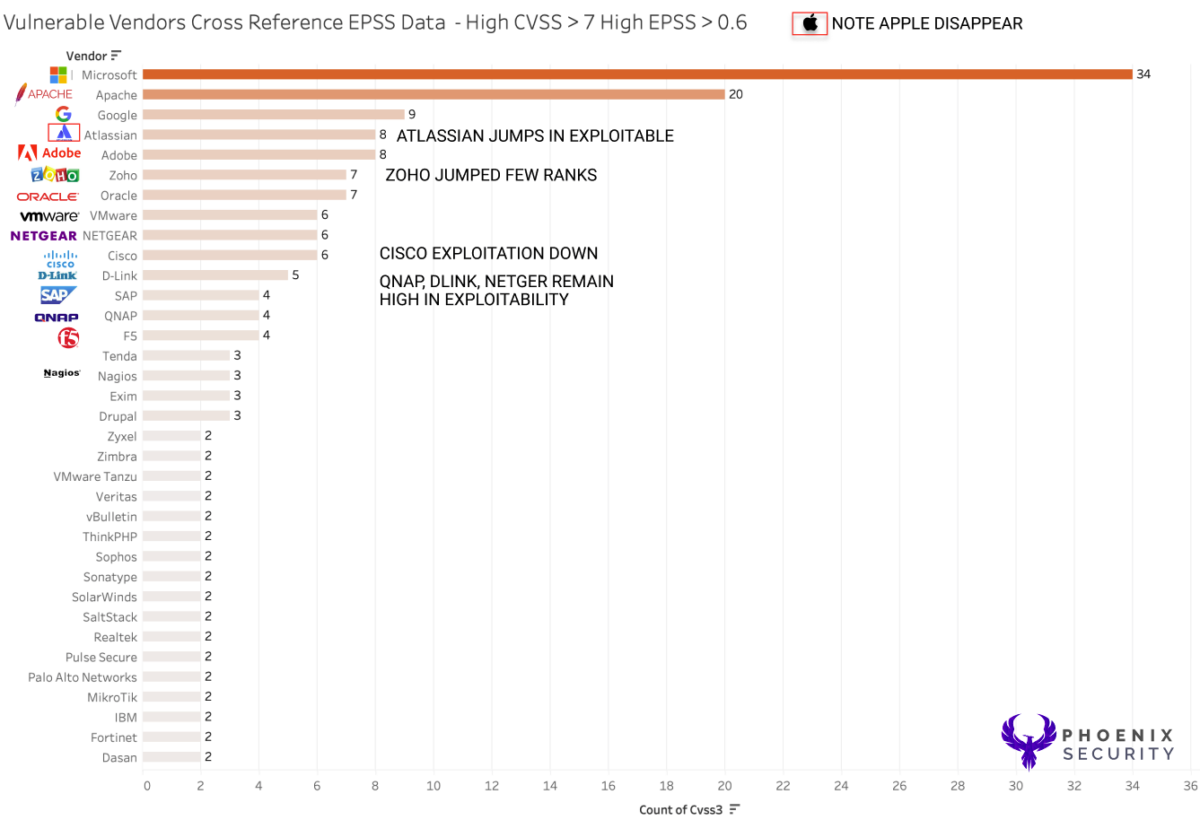
Amongst the full list of vulnerable infrastructure, software and application, the number of high exploitable vulnerabilities (EPSS> 0.6) in CISA KEV only 42% are highly exploited in the wild, according to EPSS data cross references with CISA KEV. The colour scale indicates a deeper colour for the vendor with a higher EPSS score.
Top 10 Vulnerable products
The data and value were taken by:
| Vendor Name | Number of Vuln | High Exploitable vulnerabilities | Low Exploitable vulnerabilities | Critical CVE | High CVE | Medium CVE |
| Microsoft | 259 | 116 | 143 | 83 | 1 | 109 |
| Adobe | 60 | 38 | 22 | 48 | 0 | 7 |
| Apache | 28 | 25 | 3 | 8 | 0 | 16 |
| Oracle | 31 | 22 | 9 | 11 | 0 | 12 |
| Cisco | 62 | 13 | 49 | 21 | 3 | 28 |
| VMware | 37 | 12 | 25 | 16 | 0 | 12 |
| 47 | 10 | 37 | 2 | 0 | 29 | |
| SAP | 31 | 10 | 21 | 15 | 0 | 7 |
| Netgear | 12 | 10 | 2 | 9 | 0 | 2 |
| Atlassian | 9 | 9 | 0 | 3 | 0 | 3 |
| Zoho | 9 | 9 | 0 | 2 | 0 | 4 |
| D-Link | 14 | 8 | 6 | 8 | 0 | 5 |
| Apple | 66 | 7 | 59 | 20 | 0 | 25 |
| Fortinet | 31 | 7 | 24 | 11 | 0 | 6 |
| Crestron | 22 | 5 | 17 | 11 | 0 | 5 |
| WSO2 | 22 | 5 | 17 | 11 | 0 | 5 |
| GIGABYTE | 22 | 5 | 17 | 11 | 0 | 5 |
| SugarCRM | 22 | 5 | 17 | 11 | 0 | 5 |
| Citrix | 11 | 4 | 7 | 3 | 0 | 3 |
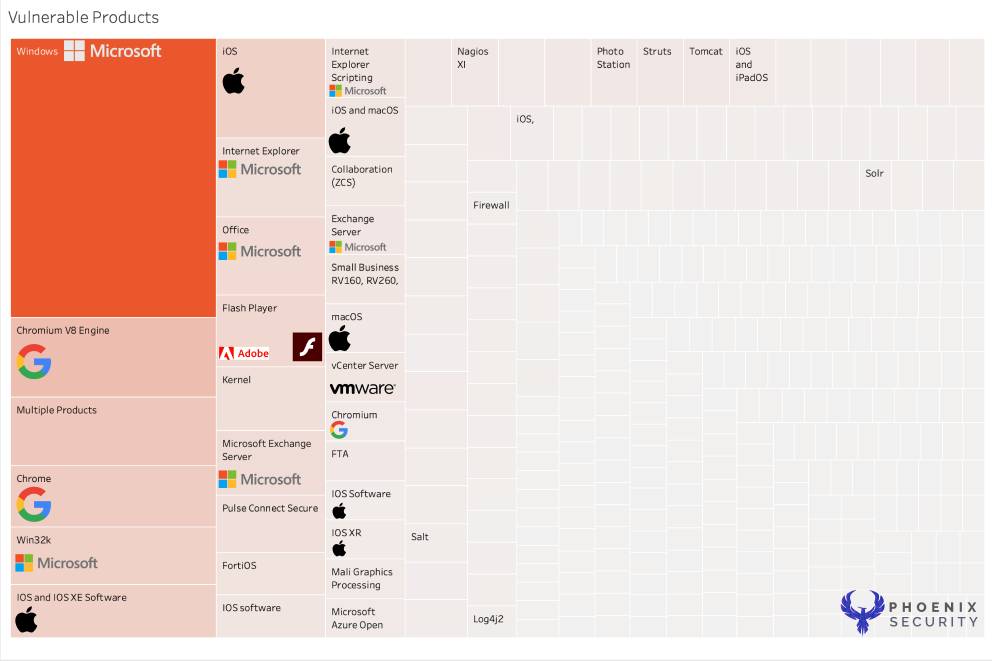

When looking at the various products, Microsoft Windows and Cisco Products score the highest as they have the highest density of product lines and number of lines of code per product.
Over the years, this data seems to be pretty consistent and shows a high level of exploitability and several vulnerable products the years.
Over 2023 (we are currently in may), we have a limited amount o dataset available.
The number of highly exploitable products compared to the product with the highest number of vulnerabilities (sum critical high, medium and low) remains coherent with the rest of the data and confirms that the vendors with the highest amount of product lines/number of code lines remain the most frequent.
Products and line of codes
One of the fallacies of the analysis is the number of lines of code/product lines; White we don’t have the number of codes per product we can assume the number of vulnerable products.
The study still has Microsoft on top, followed by Adobe; Apple has mostly two product lines, even though many individual software (reserved for future analysis) has been bumped down in places.
The picture above shows the products with the highest CVSS factor cross-referencing the EPSS score.
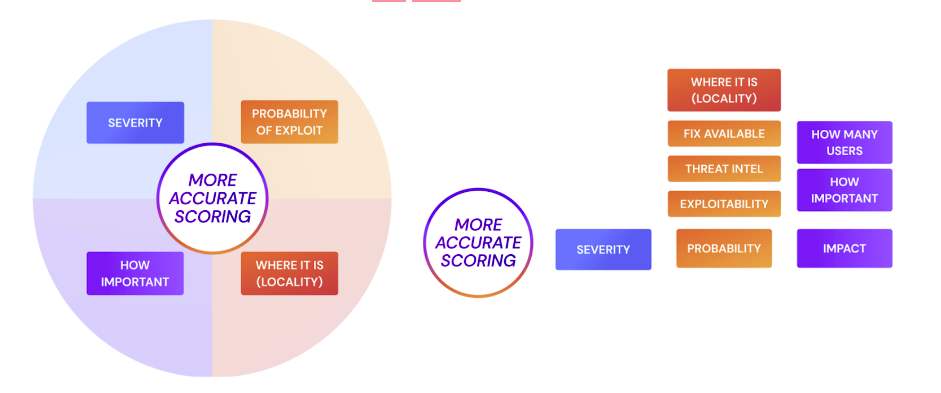
All factors should be considered when prioritizing vulnerabilities
Each factor mentioned in this research should be considered when prioritizing infrastructure and application security vulnerabilities. Considering only one factor might lead you on the wrong path.
One factor, like CVSS can help prioritise what’s more critical, but from existing research, we know that only a few elements in CISA KEV are highly exploitable. CVSS as the base value can be used as a starting point for vulnerability prioritisation with CISA kev and deciding which exploit is more dangerous.
EPSS factor can help to inform with EPSS KEV which vulnerability is more likely to get exploited
When deciding what to prioritize in patching, all the data points should be used. As shown below, selecting the highest exploitable from the EPSS score might miss some classes of vendors like Apple, which could lead into considering those vulnerabilities are not exploited in the wild or impactful. Because of the extensive attack surface, Apple vulnerabilities might be highly impacting, especially if VIP are using.
The data also confirms that Apache status, Atlassian products, libraries, and dev tools are exploited in the wild and at scale.
Conclusion: Risk-based Approach
The data shows that the vendors with the most products remain more exposed to the most exploitable vulnerabilities. Windows, by far, with a code base of 50 million lines of code, remains the most vulnerable product overall.
The dataset is useful for traditional infrastructure and patching, but the application security vulnerabilities are still scarce in the CISA KEV set.
A risk-based approach to vulnerabilities helps include all the considered elements, like CISA KEV, EPSS, impact on assets, and visibility, into one unified approach. In conclusion, not all critical vulnerabilities are equal.
A critical vulnerability on a product that is externally facing impacts on top-line revenue-generating applications, products, and server is more important than a critical vulnerability on a system that is not revenue-generating and not business-critical.
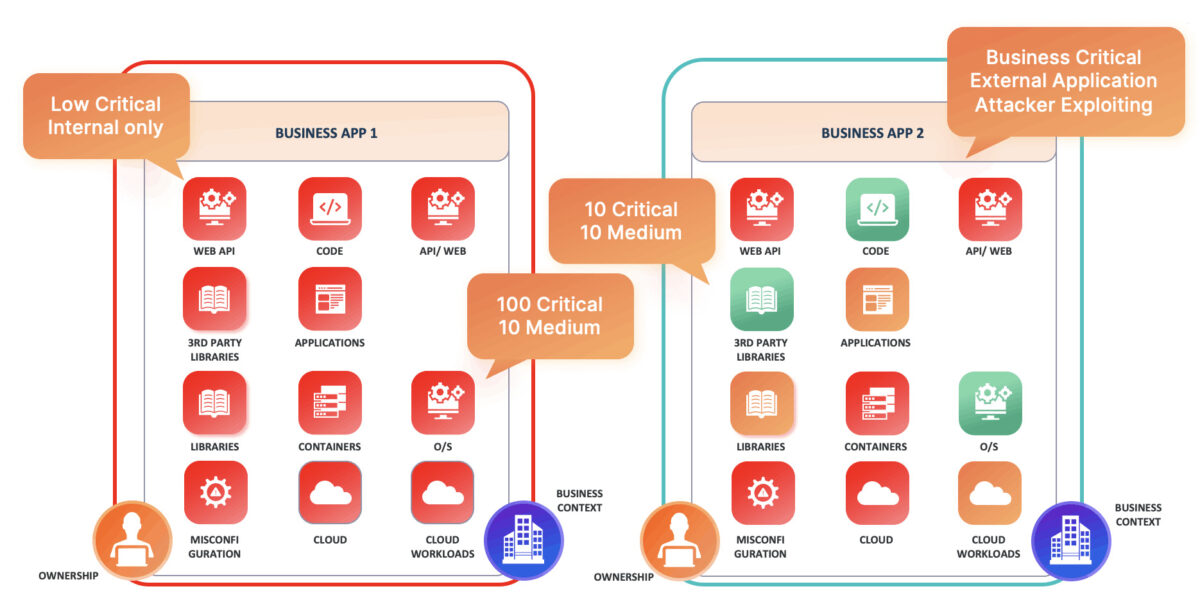
With a mature risk-based approach to application security vulnerability management, the security team can be ensured that:
- Business criticality is taken into consideration when resolving vulnerabilities
- The probability of exploitation is taken into consideration when resolving and reporting vulnerabilities. The probability o exploitation can be derived by several factors:
- Type of vulnerability (software, infrastructure, network)
- The CVSS Exploit vector (network vs physical)
- cyber threat intelligence like EPSS and CISA KEV
- Threat actors leveraging the vulnerability
- Exploitability factors, if there are exploited in the wild
- Chatter on the web about the vulnerability
- Sector-specific considerations
- Base severity is traditionally cve/cwss score