Threat intelligence tells you what a vulnerability is, your own open findings tell you what it means for you, and vulnerability triage stalls every time those two answers sit on different screens.
Key takeaways
- Read the technology and weakness of a vulnerability next to the state of your own open findings before you set its priority.
- Count the ignored findings on every vulnerability listed in CISA KEV. Give each of those ignores a named owner and a review date.
- Ask every tool where each tag came from. Treat a tag that only a language model found as a lead, and a tag that rules and the model agree on as a fact.
- Prefer a count that tells you it stopped at 5,000 over a count that guesses.
- Label every number with whose findings it counts. A team lead and an organisation admin shouldn’t see the same total and assume it means the same thing.
The problem: vulnerability management keeps the intel and the findings apart
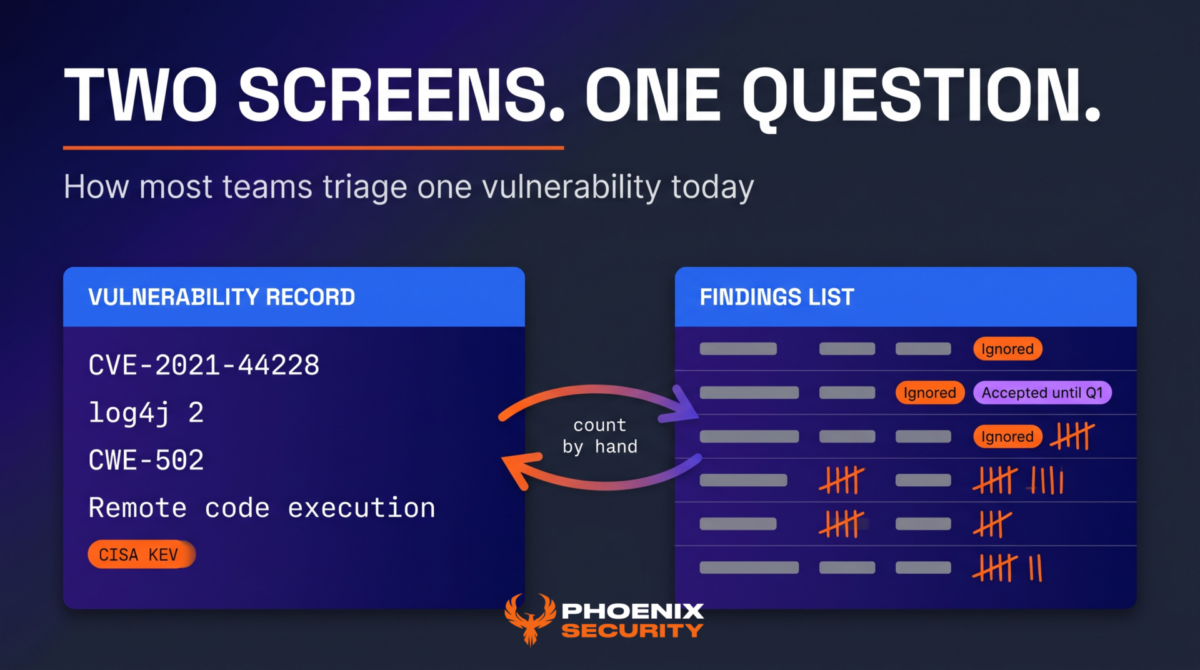
I watch AppSec engineers triage one vulnerability, and I see the same loop every time. They open the vulnerability record and read the weakness, the affected technology and whether it sits in CISA KEV. Then they leave that record, open the findings list, filter on the vulnerability and count by hand. They want to know how many findings are open, how many someone ignored, and how many sit in a custom status such as “Accepted until Q1”. Then they go back to the record and decide.
That loop is two screens for one question. It repeats for every vulnerability in the queue, and the hand count is the part people skip when the queue is long.
Take Log4Shell, CVE-2021-44228. The public record is clear. It’s a remote code execution flaw in log4j 2, NVD lists CWE-502 among its weaknesses, and CISA added it to KEV in December 2021. Not one of those facts tells you whether a third of your open findings for it are ignored, or that one team parked all of theirs in a custom status nobody reviews. The intel describes the vulnerability. Your findings describe your exposure to it.
[IMAGE 1: Two screens, one question. See ⑪ for prompt and alt text]
Security teams have plenty of data. What they’re missing is context and ownership. The data for this decision already exists in two places. The work is to put it in one.
Technical analysis: why the join never happens
Most platforms treat threat intelligence as a property of the vulnerability and treat findings as rows in a table. Both models are correct. Neither answers the triage question alone, and the join between them is harder than it looks. Four causes keep it from being built.

[IMAGE 2: Why the join never happens. See ⑪ for prompt and alt text]
Who owns the data
Technology and cyber attributes belong to the vulnerability. A log4j 2.14 tag or a CWE-502 tag is true for every finding of that vulnerability in every organisation. Ignored state, custom statuses and team tags belong to each finding, and to one organisation. A tool that copies vulnerability tags onto each finding multiplies storage and lets the copies drift. A tool that keeps them apart never shows them together. We chose a strict rule. Tags stay on the vulnerability. Only facts that are truly per finding come from the findings.
Who may see the count
Vulnerability definitions are shared. Findings are scoped to the person who reads them. A naive join counts findings the reader isn’t allowed to see, and a count is a leak even when no row is shown. A team lead with access to two applications must get a count over those two applications only. That count will differ from the organisation total, and the screen has to say so.
How many findings to count
A widespread vulnerability on a large estate links thousands of findings. An exact count of ignored states, custom statuses and tags over all of them makes the vulnerability view slower to open than it is today. Teams that hit this either drop the count or show a number that is a guess. A guess that overstates sends people after findings that don’t exist.
Where each tag came from
Technology and cyber tags now come from two kinds of source: deterministic extraction and a language model. Mixed together without a label, a model guess looks exactly like a rule match. That breaks the trust you need for a priority decision. What matters is whether the reader can tell which tags to check.
The Phoenix approach: one card, two halves
The Threat intel card in the vulnerability details puts the two answers side by side.

The left half is titled “This vulnerability”. It shows two rows of chips, Technology and Cyber. Technology holds names such as log4j 2.14. Cyber holds attributes such as CWE-502 or “Remote code execution”. Each row shows 5 chips, then a “Show more” chip that opens the rest in place. Each chip carries its source as a colour: found by Phoenix AI, found by a language model, or found by both, where the two agree. A legend under the rows explains the colours.
The right half is titled “From findings you can see”. It counts only the open findings of the vulnerability that the reader is allowed to see. It shows how many are ignored, each custom status with its count, how many have no custom status, the most common General tags and the organisation’s own AI tags. The title is deliberate. It tells a person with limited visibility that the number is theirs, not the organisation’s.
When someone opens a single finding instead of the vulnerability, the card switches to that one finding. It shows the finding’s status, its custom status and its tags, with no counts.
The same facts appear in two more places. The intelligence graph of a vulnerability gets a Technology bubble and a Cyber bubble with their counts, and a hover shows the top 3 names. The asset details section called “Additional Info” becomes “Threat intel” and adds a Cyber row for the asset’s open findings.
Each of those choices answers one of the four causes above.
Ownership stays clean. The card reads tags from the vulnerability and per-finding facts from the findings. It copies nothing and writes nothing. Every part of it is read only, and the only click is “Show more”.
Visibility comes first. The finding counts apply the same visibility rule as the Vulnerabilities list, so a reader sees the same scope in both places.
Scale has a stated limit. The card counts up to 5,000 findings. Past that, every count shows a “+”, such as “1,204+”, and a line says the numbers come from the first 5,000 findings. Every count covers the same 5,000 findings, so past the cap a number can understate and can’t overstate. The tags have their own limits: up to 200 linked vulnerability records and up to 200 labels, with a line on the card when either limit cuts the list. The graph waits at most 3 seconds for the threat intel. A slower answer leaves the bubbles out, and the rest of the graph draws as usual.
Provenance stays visible. This is Human-centric AI in practice. The model assists after the context exists, and the reader sees which tags came from the model. A language model tag becomes one more lead for an analyst, and the card labels it as one.
Real-world example: what context does to a queue
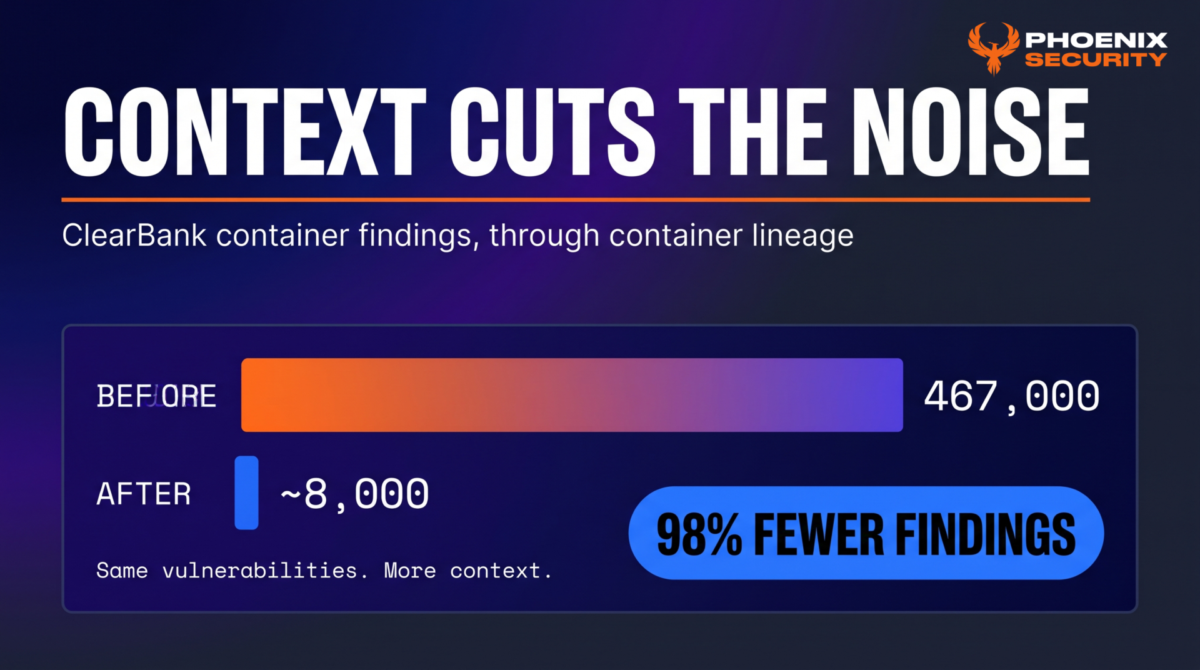
I can show what the same principle has done at scale. ClearBank cut its container findings from 467,000 to about 8,000, a 98% reduction, through container lineage. The vulnerabilities stayed the same. The context around them removed most of the noise.
The Threat intel card applies that principle one level down, to a single decision. Here is how the card reads for Log4Shell on a large estate.
The left half shows log4j with its version, and under Cyber, CWE-502 and “Remote code execution”. A purple chip means Phoenix AI found the tag. A split chip means Phoenix AI and the language model agree on it. You know which tags to trust before you read a line of the advisory.
The right half shows the reader’s open findings. Say the count passes 5,000. The card says so, and every number carries a “+”. The ignored count sits at the top. Under it come the custom statuses with their counts, and a “Not set” count for findings that never got one. The General tags show which teams and environments the findings belong to.
That’s the moment the decision changes. An exploited vulnerability with a large ignored count is an ownership problem, and the General tags tell you whose. The engineer stays on the record instead of counting by hand, because the count, its scope and the source of every tag sit in one card.
Practical guidance: what to do on Monday morning
- Pick the 10 vulnerabilities with the most open findings in your estate. For each one, write down the ignored count and the custom statuses, and time how long it takes. That time is your baseline.
- Filter that list to the vulnerabilities in CISA KEV. An ignored finding on a KEV entry needs a named owner and a review date. If it has neither, raise it with the team that owns the finding this week.
- Audit your custom statuses. A status that no longer exists in your configuration hides findings in a bucket nobody looks at. Map each old status to a current one or retire it.
- Ask each tool in your stack where its technology and weakness tags come from. If it can’t tell a rule match from a model guess, don’t let those tags drive priority on their own.
- Brief your team leads on scoped counts. A lead with access to two applications will see a smaller number than the organisation total, and both numbers are correct.
Next steps
Run the baseline in step 1 now. Then you can measure the time the card saves against your own number instead of ours.
Check that technology and cyber tags are switched on for your organization. The left half of the card depends on them, and your account contact can tell you their status.
If you want to see how Phoenix ties vulnerabilities to owners today, book a demo at https://phoenix.security/request-a-demo/.
How to turn it on
Threat intel is switched on per organisation and is off by default. The technology and security facts also need technology and cyber tags switched on for your organisation. Ask your account contact or your Phoenix Security admin to turn it on.