Phoenix Security introduces a series of targeted updates to enhance Application Security Posture Management (ASPM) and vulnerability management directly within the platform. These changes give users greater control over dashboard content, deeper visibility into findings, and more flexible ways to measure and track remediation performance.
The release adds configurable dashboard customisation, expanded findings visualisations, enhanced SLA metric controls, and new cross-dashboard performance charts—features designed to let teams filter, prioritise, and act on security data with minimal friction. Each update is built to reduce noise, surface the most relevant risks, and speed up the path from detection to closure.
What’s New in Phoenix Security Application Security Posture Management (ASPM)
New dashboard features and customizations
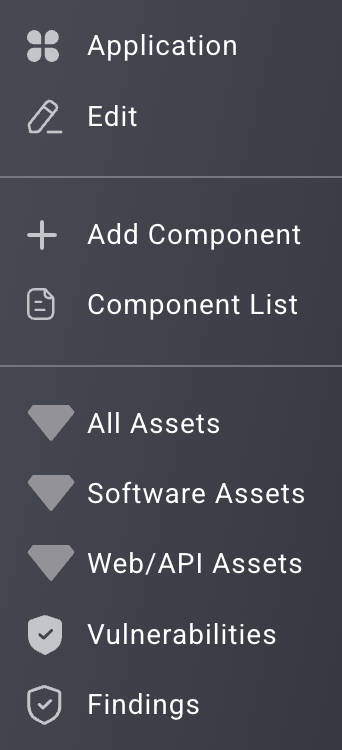
New dashboard features offer enhanced customization and prioritization to view and manage your security landscape. It now includes:
- Custom Dashboards: Use the custom dashboards toggle to select which features are displayed across only your dashboard or all organisation users’ dashboards.
- Top 10 Apps and Services: New tables displaying top 10 highest criticality Applications and Services.
- Findings Status Timeline and MTTR charts: Track remediation efforts by the number of fixes and my the mean time to resolution.
- SLA switch: Switch global view of SLA dashboards metrics between time from scanner picking the finding up to resolution or based on ticket creation to ticket closure.
Additional features
- New Notification area
- Top 10 Libs (Team dashboard)
- Best changes/lowest frequency change teams (Security Dashboard)
- Lifecycle management (GC) for Imported Assets and Findings
- Filters saved for Campaigns summary
Get in control of your Application Security posture and Vulnerability management
New Executive Dashboard features
This release introduces new features to our key dashboards: main, security and team.
Dashboard customization
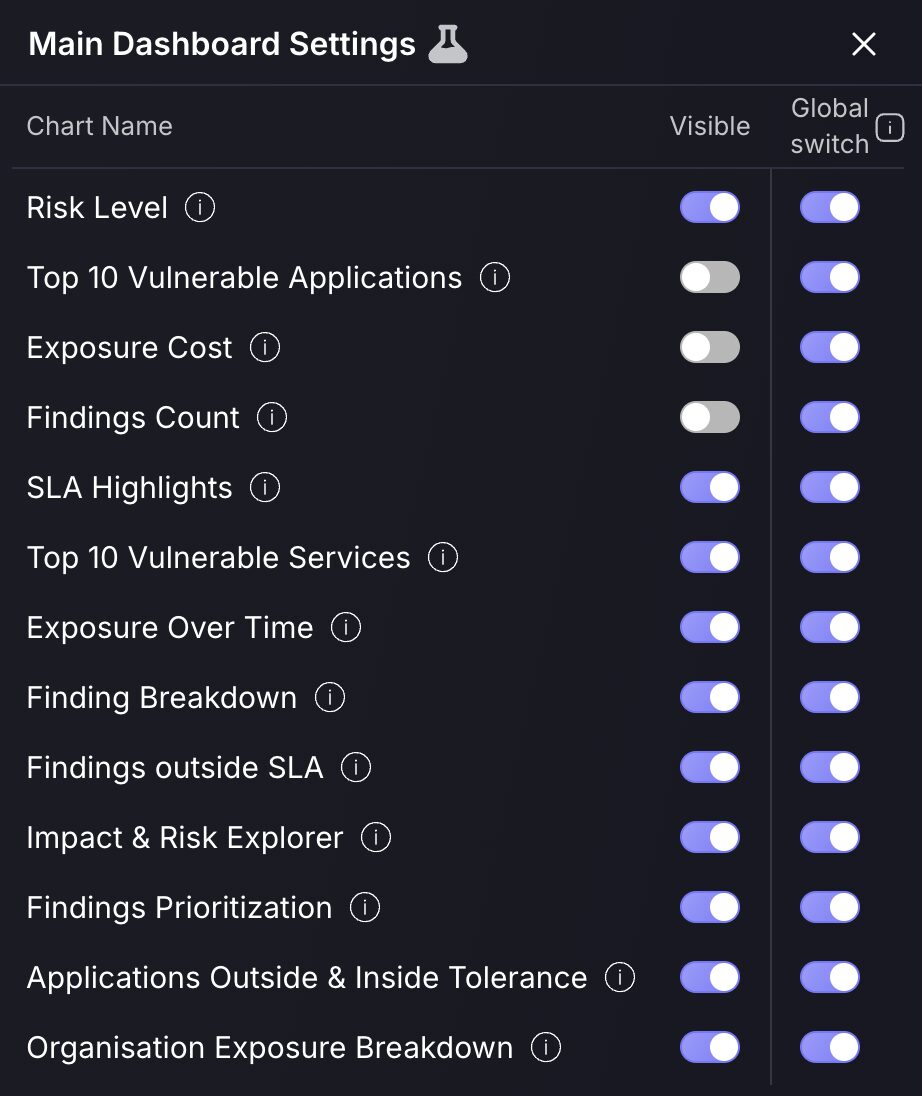
We’ve just rolled out a powerful new Dashboard Customization feature, giving every user the ability to tailor their dashboard views across Executive, Security, and Team dashboards. With a simple toggle interface, users can control which charts are visible on their personal dashboards—everything from “Risk Level” to “Findings Breakdown” and “Exposure Cost”—making it easy to focus only on what matters most.
Admins now also have access to a Global Switch for each chart, allowing them to disable specific widgets across the entire organisation’s dashboard. This is especially useful for enforcing consistency across different roles or streamlining views for executive reporting. Meanwhile, individual users can still use the Visible toggle to personalise their own experience without affecting others.
Whether you’re an executive interested in high-level risk metrics or an analyst digging into SLA compliance and vulnerability trends, this feature makes dashboards cleaner, more relevant, and easier to use.
Top 10 Apps and Services
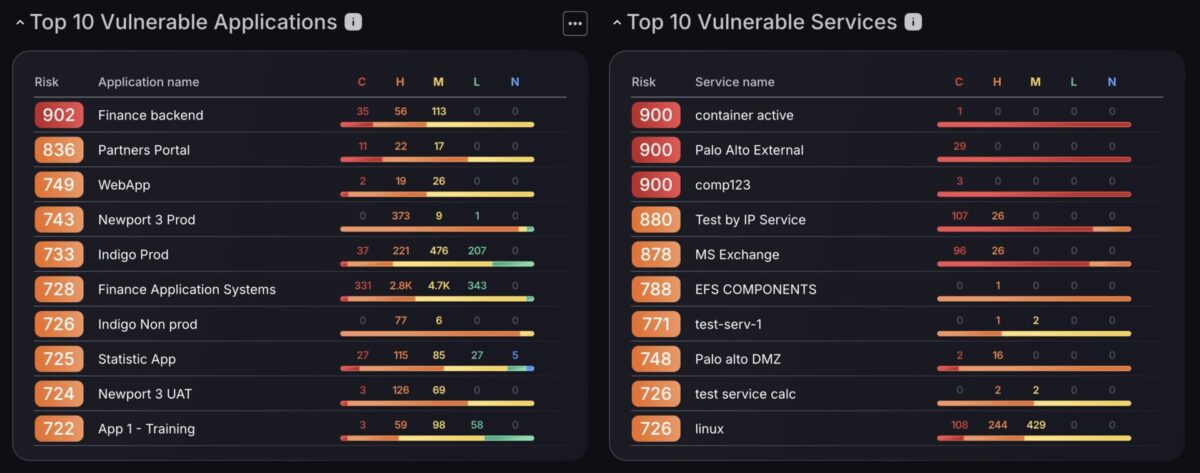
The Top 10 Vulnerable Applications and Top 10 Vulnerable Services charts are built to surface the highest criticality applications and services within your organisation. By ranking based on risk level, these widgets allow executives to quickly identify which applications and services demand the most attention, whether due to volume, criticality, or concentration of high-impact vulnerabilities.
Each entry provides a full severity breakdown across critical to negligible levels, helping users understand not just how many issues exist, but how serious they are.
For users who want to dig deeper, each application or service also includes a shortcut menu, allowing quick access to related vulnerabilities, findings, and asset types. While optional, these links help streamline deeper investigation without breaking focus, making it easier to take action straight from the overview.
Findings Status Timeline and MTTR charts
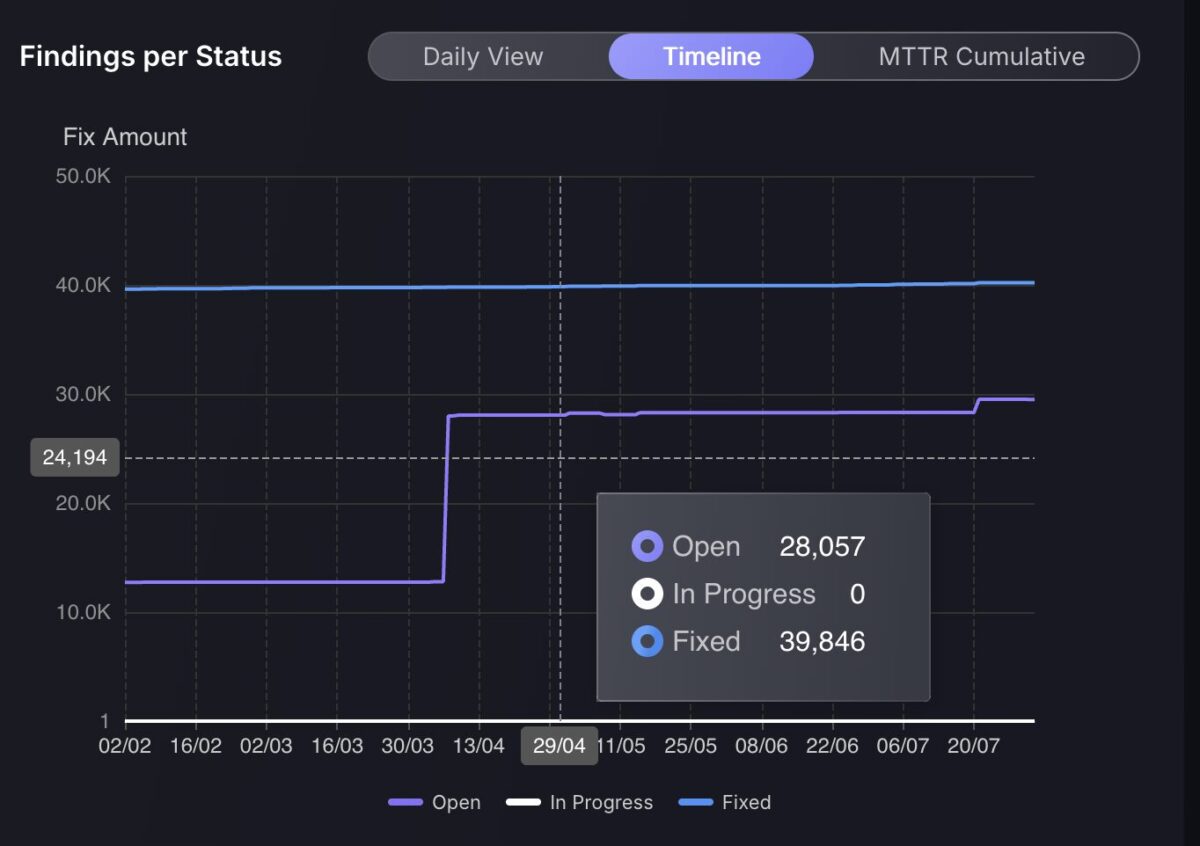
The Findings per Status chart has been expanded with two powerful new views, Timeline and MTTR Cumulative, enhancing visibility into how findings evolve over time and how long they take to resolve. These additions complement the original Daily View by offering a broader context for trend analysis and performance measurement.
The Timeline view visualises the accumulation of findings across statuses: open, in progress, and fixed. This gives teams the ability to observe how their remediation efforts track over weeks and months. It helps identify periods of increased activity, stagnation, or sudden resolution spikes, making it easier to correlate progress with operational events.
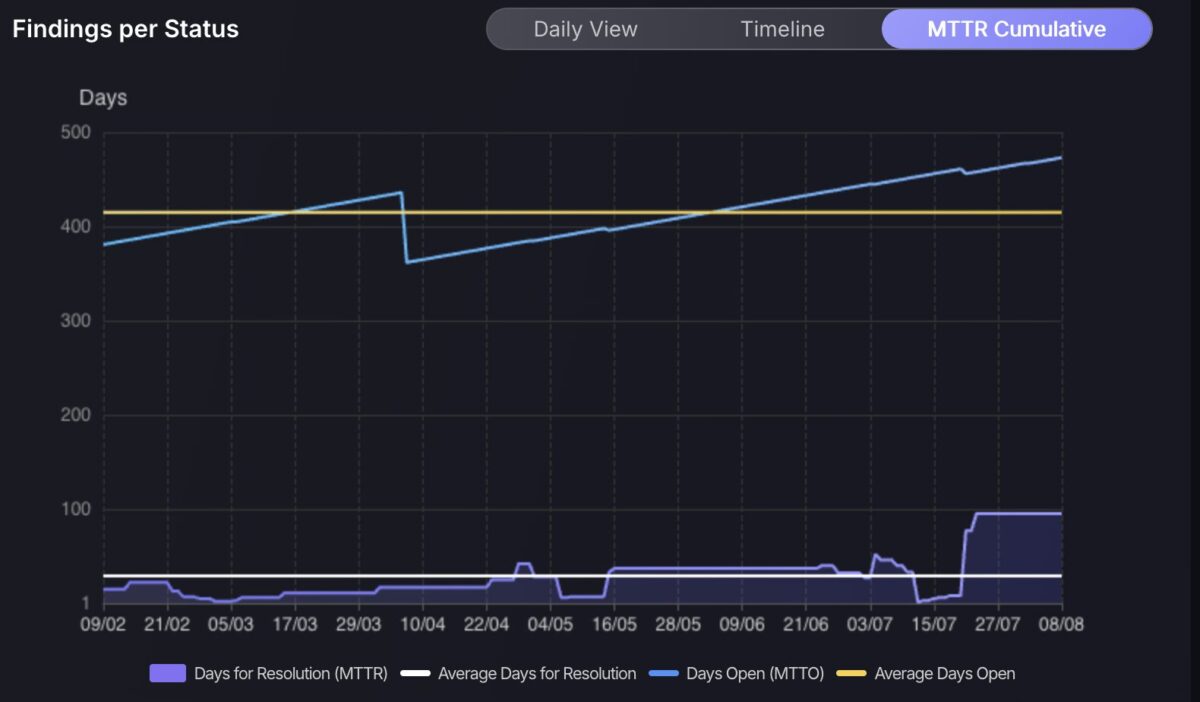
Meanwhile, the MTTR Cumulative view focuses on long-term efficiency, surfacing trends in Mean Time to Resolution (MTTR) and Time to Open (MTTO). This view supports strategic planning by helping teams understand how ageing findings impact their overall metrics and where improvements in fix velocity could have the greatest impact. Together, these new views turn findings data into an actionable narrative.
SLA switch
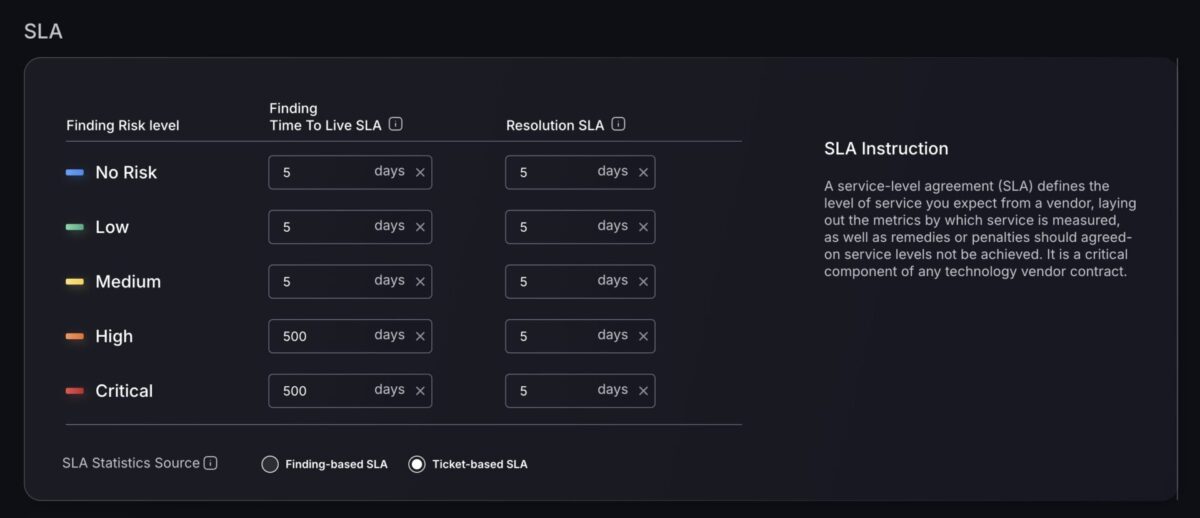
The new Global SLA Statistics Source Toggle gives you greater flexibility in how SLA metrics are calculated and displayed across your dashboards. With this control, you can choose between two distinct SLA measurement approaches, ensuring the data aligns with your team’s priorities and operational processes.
One option is Finding-Based SLA, which measures SLA performance based on how long each finding has been open, ideal for focusing on the age of unresolved issues and their compliance status over time. The alternative is Ticket-Based SLA, which tracks SLA from the moment a ticket is opened to when it’s closed, perfect for monitoring end-to-end resolution workflows and operational efficiency.
By switching between these modes, you can adapt SLA reporting to match your organisation’s specific needs, whether that’s driving faster remediation of findings or streamlining ticket management performance.
Team and Security Dashboard additions
Best Changes and Lowest change frequency charts
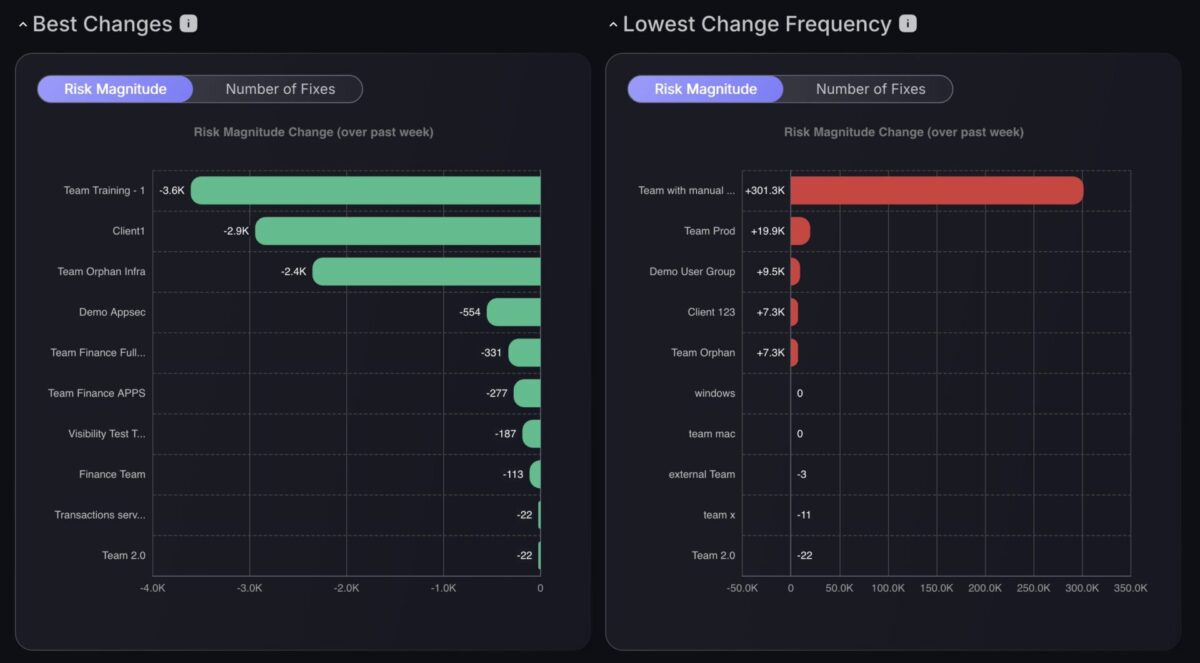
The Best Changes and Lowest Change Frequency charts, originally launched on the Teams Dashboard, are now available on the Security Dashboard, giving security leaders direct visibility into team performance without switching contexts.
These charts enable leaders to assess performance in two ways: by risk magnitude, which measures the overall impact of fixes on reducing risk, and by number of fixes, which tracks productivity based on the total closed tickets per team. This dual view not only provides a balanced perspective on both the quality and quantity of remediation work but also helps identify high-impact teams, spot stagnation where change frequency is low, and uncover bottlenecks or ownership gaps before SLAs slip.
Security leaders can use these insights to allocate resources where they’ll deliver the greatest risk reduction, provide targeted coaching to underperforming teams, set fair benchmarks and quarterly targets, and communicate clear progress to executives and boards. It also creates an opportunity to celebrate and recognise teams consistently delivering impactful changes, reinforcing the right remediation behaviours across the organisation.
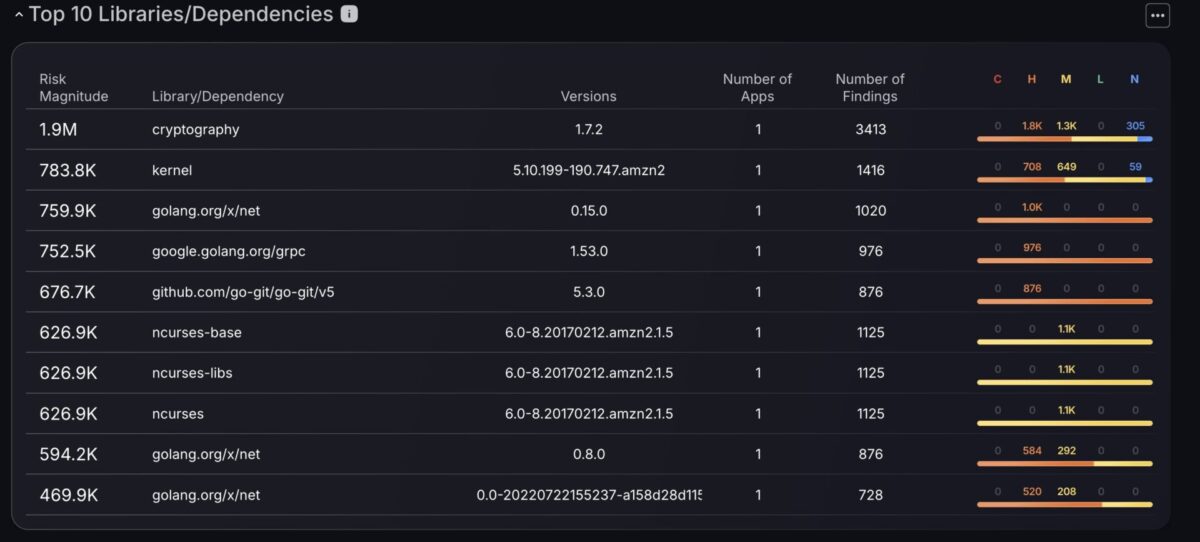
Top 10 Libraries/Dependencies
The Top 10 Libraries/Dependencies chart, previously exclusive to the Security Dashboard, is now available on the Teams Dashboard, bringing powerful dependency-level insights directly to the teams responsible for remediation. This feature highlights the libraries and dependencies contributing the highest risk, factoring in both the number and severity of findings, as well as the number of findings linked to these applications.
By exposing these insights at the team level, security teams can identify high-risk dependencies early, prioritise library upgrades or patches, and reduce systemic vulnerabilities tied to widely used dependencies. The inclusion of severity breakdowns ensures teams can focus on the most impactful fixes first, rather than being overwhelmed by volume alone.
This addition empowers teams to take direct ownership of dependency risks, speeding up response times, improving collaboration with security leads, and ensuring that fixes are aligned with overall risk reduction priorities.
Other Enhancements
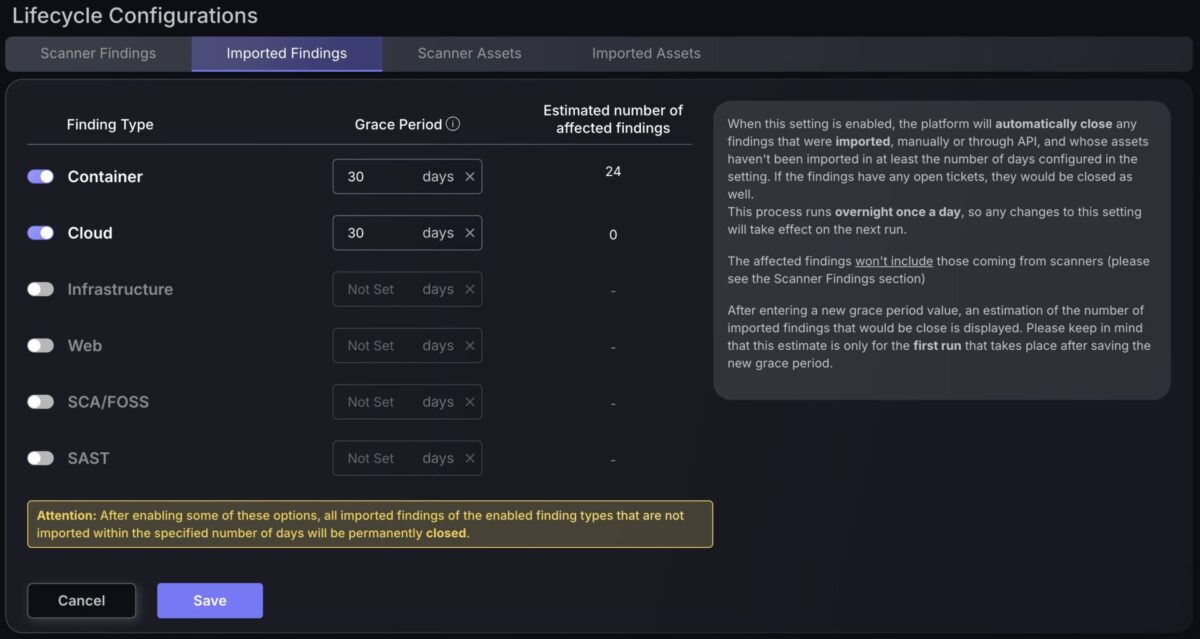
Lifecycle management for Imported Assets and Findings
You can now set custom grace periods for the automatic closure of findings or assets that are not re-imported within a defined number of days. This allows you to fine-tune visibility rules so that only relevant, up-to-date items remain on your dashboards.
Grace periods can be configured per asset grouping, giving you the flexibility to align closure timelines with your organisation’s operational priorities. For example, you might set a longer grace period for container assets, which may be imported manually on a less frequent schedule, while assigning a shorter grace period for cloud assets that are regularly updated through API imports.
This feature supports both manual and API-based imports, enabling you to tailor closure policies to your specific workflows, whether that’s high-frequency automated ingestion or occasional, targeted manual updates. The result is a cleaner, more relevant set of findings and assets that better reflect your true security posture.
Filters saved for Campaigns summary

The Campaigns summary now remembers selected filters to ensure that you have streamlined access to the Campaigns that matter most to you.
New Notifications area
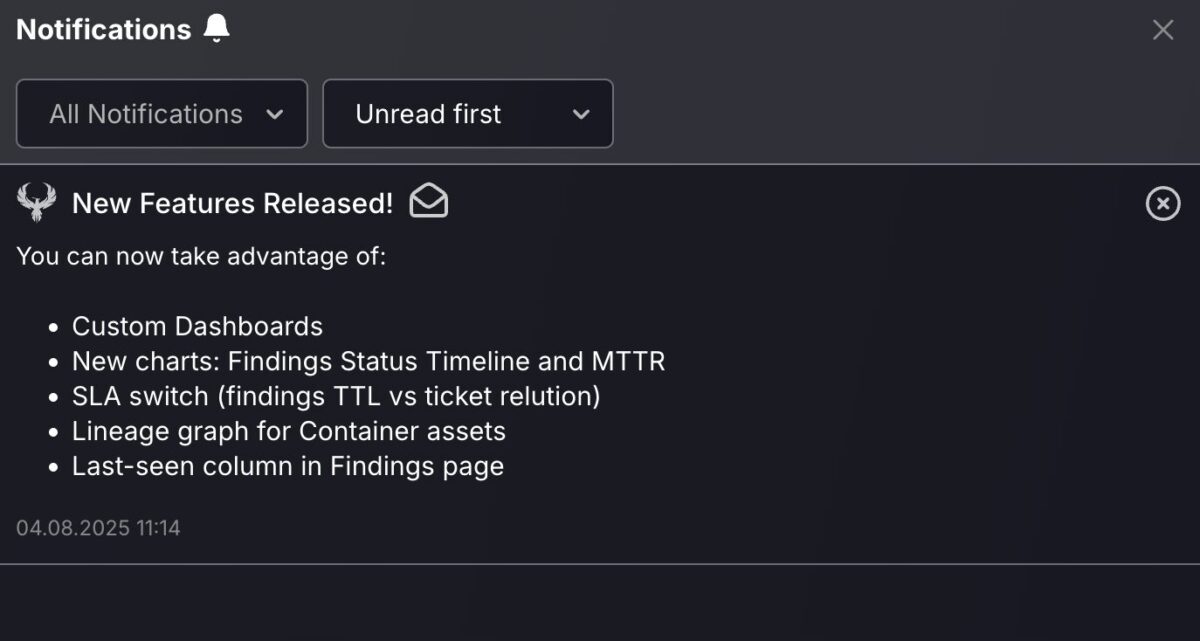
The new Notifications Area centralises all your important updates in one place, making it easier to stay on top of what matters most. Notifications are organised into three categories, Alerts, Warnings, and Info, so you can quickly filter and focus on the updates that are most relevant to you.
Alerts highlight critical issues that require immediate attention, while Warnings flag potential risks or conditions that may need action soon. Info keeps you informed about non-urgent updates, such as new feature releases, enhancements, or general system announcements.
With filtering options and an unread-first view, the Notifications Area ensures you won’t miss essential updates while still being able to browse less urgent information.
Ready to Slash the Noise?
If you’re tired of chasing vulnerabilities that don’t matter—or worse, don’t even exist in runtime—Phoenix Security’s Container Lineage, Contextual Deduplication, and Throttling features are built to cut your backlog down to what’s real.
Not noise. Not theory. Actionable security.
📍 Want to dive deeper?
How Phoenix Security Can Help with Container Vulnerability Sprawl

Application Security and Vulnerability Management teams are tired of alert fatigue. Engineers are buried in vulnerability lists that say everything is critical. And leadership? They want to know what actually matters.
Phoenix Security changes the game.

With our AI Second Application Security Posture Management (ASPM), powered by container lineage, contextual deduplication, and container throttling, we help organizations reduce container false positives up to 98% and remove up to 78% of false positives in container open source libraries, pointing the team to the right remediation

Why Container Lineage Matters:
Most platforms tell you there’s a problem. Phoenix Security tells you:
- Where it lives (code, build, container, cloud)
- Who owns it
- If it’s running
- If it’s exploitable
- How to fix it
All of this is delivered in one dynamic, prioritized list, mapped to the real attack paths and business impact of your applications.
Here’s What You Get:
- Contextual Intelligence from Code to Runtime: Understand which vulnerable components are actually deployed and reachable in production, not just listed in a manifest.
- Noise Reduction with Automated Throttling: Disable inactive container alerts and slash duplicate findings by over 90%, letting your team focus on the vulnerabilities that matter.
- 4D Risk Scoring That Maps to Real-World Threats: Built-in exploit intelligence, Probability of exploitation, EPSS, exposure level, and business impact baked into a customizable formula. No more CVSS-only pipelines.

Vulnerability overload isn’t a badge of diligence—it’s a liability.
Container lineage in Phoenix Security helps you shut down false positives, stop chasing ghosts, and start solving the right problems.
Or learn how Phoenix Security slashed millions in wasted dev time for fintech, retail, and adtech leaders.